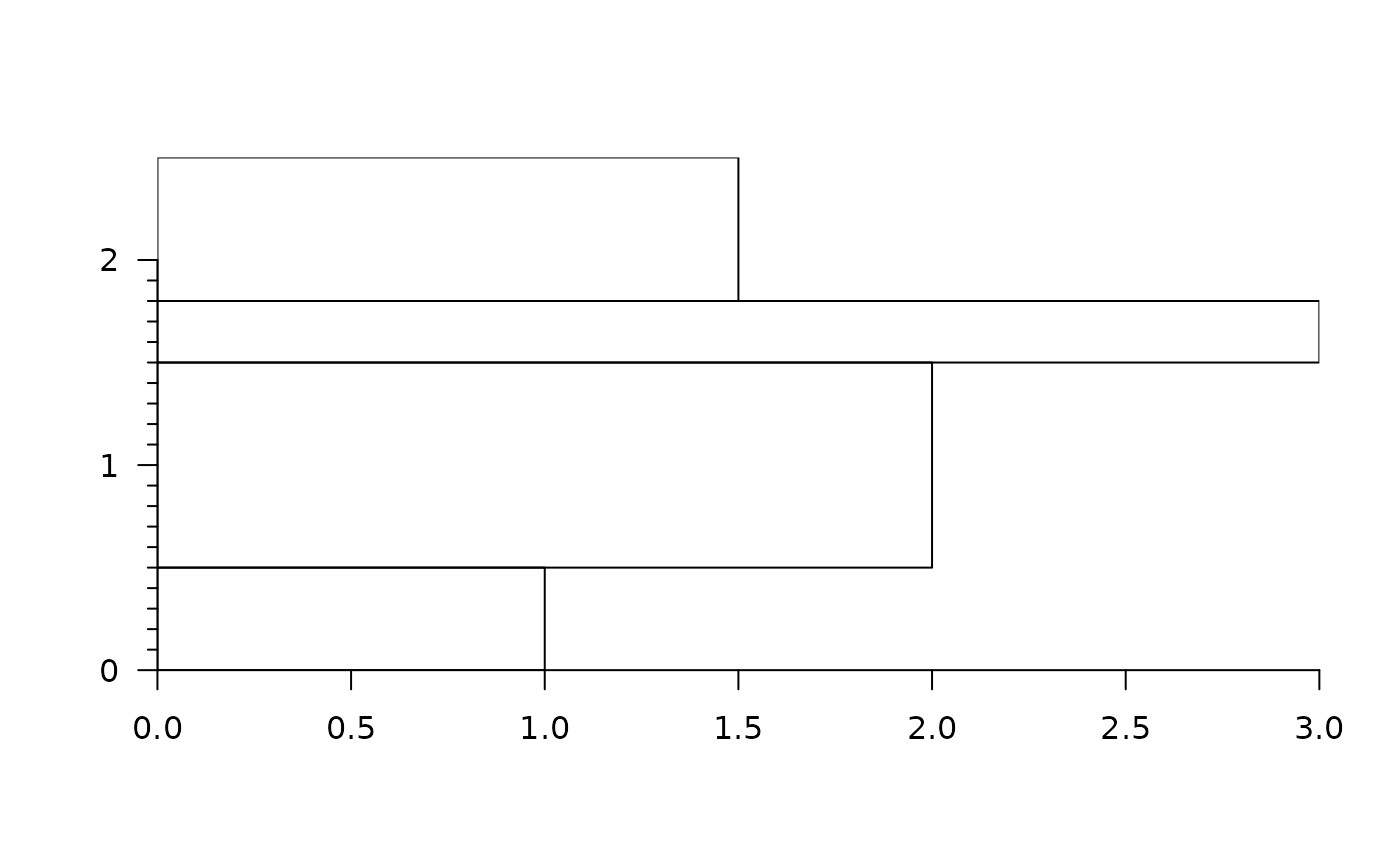
wraps around StratigrapheR::litholog() to plot a stratigraphic column. The beds are plotted as polygons, the boundaries as horizontal lines.
Usage
# S3 method for class 'stratcol'
plot(x, ...)Examples
s = as_stratcol(c(0.5, 1, 0.3, 0.7), c(1,2,3,1.5), L_unit = "m")
# facies codes are used as hardness
plot(s)