Simulates stasis of mean trait values as independent, normally distributed random variables with mean mean and standard deviation sd
Value
A list with two elements: t and y. t is a duplicate of the input t, y are the corresponding trait values. Output list is of S3 class timelist (inherits from list) and can thus be plotted directly using plot, see ?admtools::plot.timelist
See also
random_walk()andornstein_uhlenbeck()to simulate other modes of evolutionstasis_sl()to simulate stasis on specimen level - for usage in conjunction with thepaleoTSpackage.
Examples
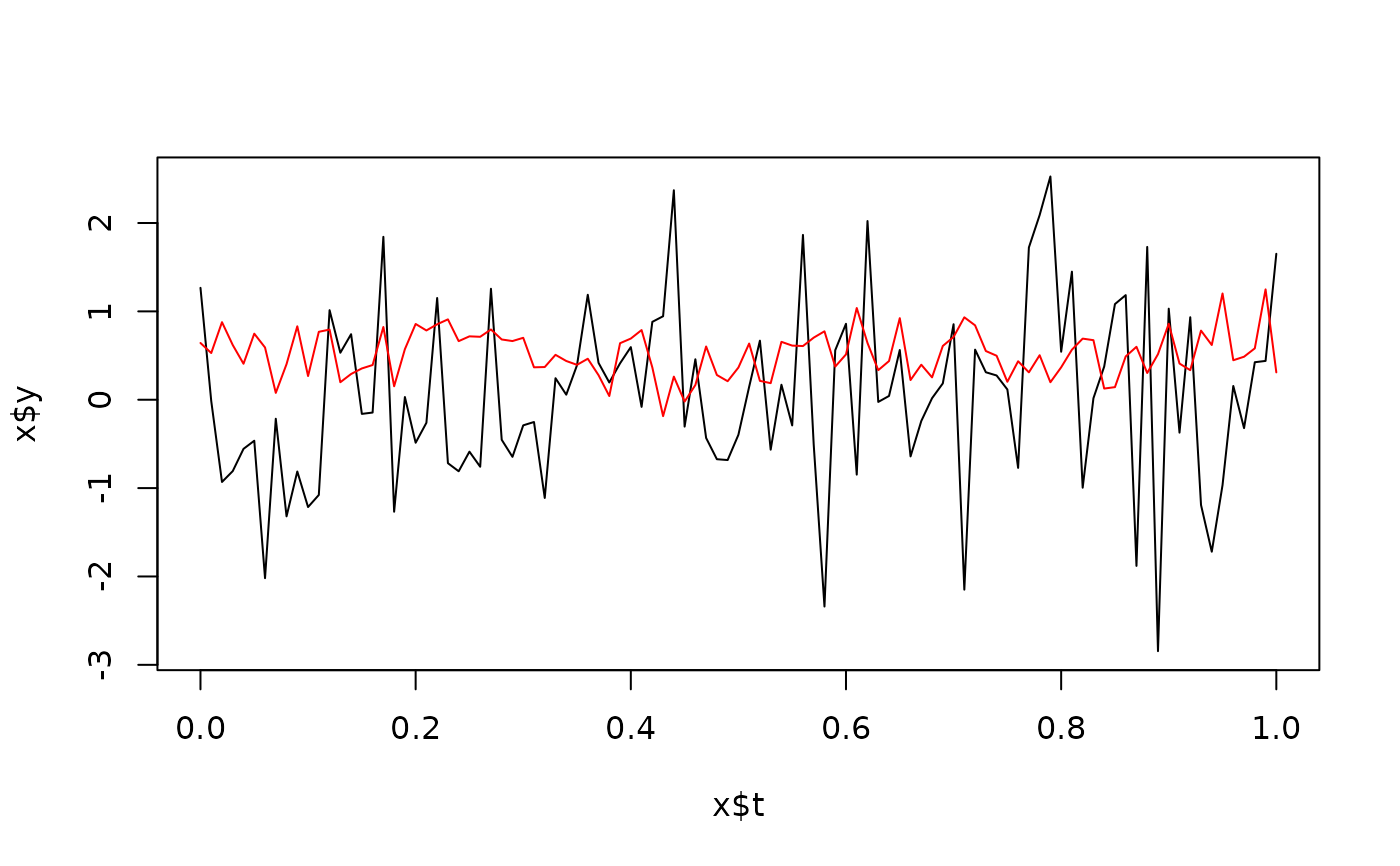
 library("admtools") # required for plotting of results
 t = seq(0, 1, by = 0.01)
 l = stasis(t)
 plot(l, type = "l") # plot lineage
 l2 = stasis(t, mean = 0.5, sd = 0.3) # simulate second lineage
 lines(l2$t, l2$y, col = "red") # plot second lineage